 W
WA debugger or debugging tool is a computer program used to test and debug other programs. The main use of a debugger is to run the target program under controlled conditions that permit the programmer to track its operations in progress and monitor changes in computer resources that may indicate malfunctioning code. Typical debugging facilities include the ability to run or halt the target program at specific points, display the contents of memory, CPU registers or storage devices, and modify memory or register contents in order to enter selected test data that might be a cause of faulty program execution.
 W
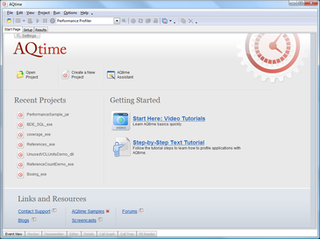
WAQtime is a performance profiler and memory/resource debugging toolset developed by SmartBear Software. It is integrated into Microsoft Visual Studio, Visual Studio Test Projects and Embarcadero RAD Studio that allows analyzing the application without leaving the development environment.
 W
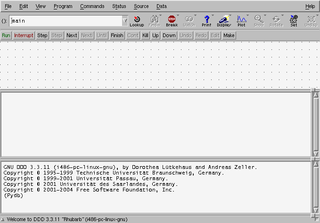
WData Display Debugger is a graphical user interface for command-line debuggers such as GDB, DBX, JDB, HP Wildebeest Debugger, XDB, the Perl debugger, the Bash debugger, the Python debugger, and the GNU Make debugger. DDD is part of the GNU Project and distributed as free software under the GNU General Public License.
 W
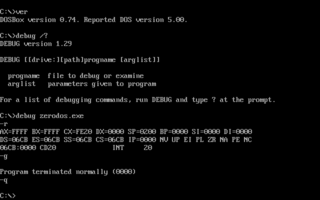
WThe line-oriented debugger DEBUG is an external command in operating systems such as DOS, OS/2 and Windows.
 W
WDTrace is a comprehensive dynamic tracing framework originally created by Sun Microsystems for troubleshooting kernel and application problems on production systems in real time. Originally developed for Solaris, it has since been released under the free Common Development and Distribution License (CDDL) in OpenSolaris and its descendant illumos, and has been ported to several other Unix-like systems.
 W
WDynamic Debugging Technique (DDT) is a series of debugger programs originally developed for Digital Equipment Corporation (DEC) hardware, initially known as DEC Debugging Tape because it was distributed on paper tape. The name is a pun on the insecticide DDT. The first version of DDT was developed at MIT for the PDP-1 computer in 1961, but newer versions on newer platforms continued to use the same name. After being ported to other vendor's platforms and changing media, the name was changed to the less DEC-centric version. Early versions of Digital Research's CP/M and CP/M-86 kept the DEC name DDT for their debugger, however, now meaning "Dynamic Debugging Tool". The CP/M DDT was later superseded by the Symbolic Instruction Debugger in DR DOS and GEM.
 W
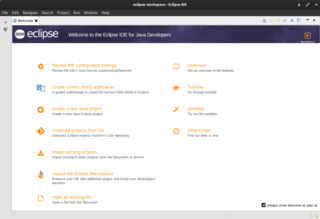
WEclipse is an integrated development environment (IDE) used in computer programming. It contains a base workspace and an extensible plug-in system for customizing the environment. Eclipse is written mostly in Java and its primary use is for developing Java applications, but it may also be used to develop applications in other programming languages via plug-ins, including Ada, ABAP, C, C++, C#, Clojure, COBOL, D, Erlang, Fortran, Groovy, Haskell, JavaScript, Julia, Lasso, Lua, NATURAL, Perl, PHP, Prolog, Python, R, Ruby, Rust, Scala, and Scheme. It can also be used to develop documents with LaTeX and packages for the software Mathematica. Development environments include the Eclipse Java development tools (JDT) for Java and Scala, Eclipse CDT for C/C++, and Eclipse PDT for PHP, among others.
 W
WEclipse Che is an open-source, Java-based developer workspace server and Online IDE. It includes a multi-user remote development platform. The workspace server comes with a flexible RESTful webservice. It also contains a SDK for creating plug-ins for languages, frameworks or tools. Eclipse Che is an Eclipse Cloud Development (ECD) top-level project, allowing contributions from the user community.
eric is a free integrated development environment (IDE) used for computer programming. Since it is a full featured IDE, it provides by default all necessary tools needed for the writing of code and for the professional management of a software project.
 W
WThe GNU Debugger (GDB) is a portable debugger that runs on many Unix-like systems and works for many programming languages, including Ada, C, C++, Objective-C, Free Pascal, Fortran, Go, and partially others.
Instruments is an application performance analyzer and visualizer, integrated in Xcode 3.0 and later versions of Xcode. It is built on top of the DTrace tracing framework from OpenSolaris, which was ported to Mac OS X v10.5 and which is available in all following versions of macOS.
 W
WThe Java Platform Debugger Architecture (JPDA) is a collection of APIs to debug Java code.Java Debugger Interface (JDI) - defines a high-level Java language interface that developers can easily use to write remote debugger application tools. Java Virtual Machine Tools Interface (JVMTI), a native interface that helps to inspect the state and to control the execution of applications running in the Java Virtual Machine (JVM). Java Virtual Machine Debug Interface (JVMDI)- JVMDI was deprecated in J2SE 5.0 in favor of JVM TI, and was removed in Java SE 6. Java Debug Wire Protocol (JDWP) - defines communication between debuggee and debugger processes.
JEB is a disassembler and decompiler software for Android applications and native machine code. It decompiles Dalvik bytecode to Java source code, and MIPS, ARM, x86 32-bit, x86 64-bit machine code to C source code. The assembly and source outputs are interactive and can be refactored. Users can also write their own scripts and plugins to extend JEB functionality.
 W
WKDbg is a free and open-source graphical front-end for the GNU Debugger. KDbg is implemented using the KDE component architecture.
 W
WMacsBug is a low-level debugger for the classic Mac OS. MacsBug is an acronym for Motorola Advanced Computer Systems Debugger, as opposed to Macintosh debugger. The original version was developed by Motorola as a general debugger for its 68000 systems — it was ported to the Mac as a programmer's tool early in the project's development.
Nemiver is computer software, a graphical standalone debugger for the programming languages C and C++, which integrates in the GNOME desktop environment. It currently features a backend which uses the well known GNU Debugger (GDB). The creator and the current lead developer is Dodji Seketeli.
 W
WPadre is a multi-language software development platform comprising an IDE and a plug-in system to extend it. It is written primarily in Perl and is used to develop applications in this language.
PGI was a company that produced a set of commercially available Fortran, C and C++ compilers for high-performance computing systems. On July 29, 2013, NVIDIA Corporation acquired The Portland Group, Inc. As of August 5, 2020, the "PGI Compilers and Tools" technology is a part of the NVIDIA HPC SDK product available as a free download from NVIDIA.
 W
WRadare2 is a complete framework for reverse-engineering and analyzing binaries; composed of a set of small utilities that can be used together or independently from the command line. Built around a disassembler for computer software which generates assembly language source code from machine-executable code, it supports a variety of executable formats for different processor architectures and operating systems.
 W
WIn computing, SystemTap (stap) is a scripting language and tool for dynamically instrumenting running production Linux kernel-based operating systems. System administrators can use SystemTap to extract, filter and summarize data in order to enable diagnosis of complex performance or functional problems.
Valgrind is a programming tool for memory debugging, memory leak detection, and profiling.
 W
WVOGL is a debugger for the OpenGL rendering API intended to be used in the development of video games. VOGL was originally written at RAD Game Tools and Valve. VOGL is free and open-source software subject to the terms of the MIT License.
Xdebug is a PHP extension which provides debugging and profiling capabilities. It uses the DBGp debugging protocol.