 W
WActivity diagrams are graphical representations of workflows of stepwise activities and actions with support for choice, iteration and concurrency. In the Unified Modeling Language, activity diagrams are intended to model both computational and organizational processes, as well as the data flows intersecting with the related activities. Although activity diagrams primarily show the overall flow of control, they can also include elements showing the flow of data between activities through one or more data stores.
 W
WArchiMate is an open and independent enterprise architecture modeling language to support the description, analysis and visualization of architecture within and across business domains in an unambiguous way.
 W
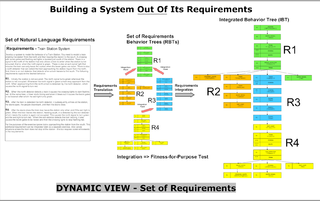
WBehavior trees are a formal, graphical modelling language used primarily in systems and software engineering. Behavior trees employ a well-defined notation to unambiguously represent the hundreds or even thousands of natural language requirements that are typically used to express the stakeholder needs for a large-scale software-integrated system.
 W
WA block diagram is a diagram of a system in which the principal parts or functions are represented by blocks connected by lines that show the relationships of the blocks. They are heavily used in engineering in hardware design, electronic design, software design, and process flow diagrams.
 W
WA bond graph is a graphical representation of a physical dynamic system. It allows the conversion of the system into a state-space representation. It is similar to a block diagram or signal-flow graph, with the major difference that the arcs in bond graphs represent bi-directional exchange of physical energy, while those in block diagrams and signal-flow graphs represent uni-directional flow of information. Bond graphs are multi-energy domain and domain neutral. This means a bond graph can incorporate multiple domains seamlessly.
 W
WBusiness Process Model and Notation (BPMN) is a graphical representation for specifying business processes in a business process model.
 W
WA chart is a graphical representation for data visualization, in which "the data is represented by symbols, such as bars in a bar chart, lines in a line chart, or slices in a pie chart". A chart can represent tabular numeric data, functions or some kinds of quality structure and provides different info.
 W
WA control-flow diagram (CFD) is a diagram to describe the control flow of a business process, process or review.
 W
WIn computer science, a control-flow graph (CFG) is a representation, using graph notation, of all paths that might be traversed through a program during its execution. The control-flow graph is due to Frances E. Allen, who notes that Reese T. Prosser used boolean connectivity matrices for flow analysis before.
 W
WData structure diagram (DSD) is a diagram of the conceptual data model which documents the entities and their relationships, as well as the constraints that connect to them.
 W
WDRAKON is an algorithmic visual programming and modeling language developed within the Buran space project following ergonomic design principles. The language provides a uniform way to represent flowcharts of any complexity that are easy to read and understand.
 W
WAn entity–relationship model describes interrelated things of interest in a specific domain of knowledge. A basic ER model is composed of entity types and specifies relationships that can exist between entities.
 W
WEvent chain diagrams are visualizations that show the relationships between events and tasks and how the events affect each other.
 W
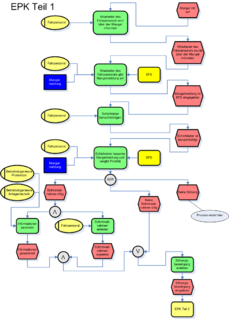
WAn event-driven process chain (EPC) is a type of flow chart for business process modeling. EPC can be used to configure enterprise resource planning execution, and for business process improvement. It can be used to control an autonomous workflow instance in work sharing.
 W
WEXPRESS is a standard data modeling language for product data. EXPRESS is formalized in the ISO Standard for the Exchange of Product model STEP, and standardized as ISO 10303-11.
 W
WExtended Enterprise Modeling Language (EEML) in software engineering is a modelling language used for Enterprise modelling across a number of layers.
 W
WA flowchart is a type of diagram that represents a workflow or process. A flowchart can also be defined as a diagrammatic representation of an algorithm, a step-by-step approach to solving a task.
 W
WIn systems engineering, software engineering, and computer science, a function model or functional model is a structured representation of the functions within the modeled system or subject area.
 W
WA functional flow block diagram (FFBD) is a multi-tier, time-sequenced, step-by-step flow diagram of a system’s functional flow. The term "functional" in this context is different from its use in functional programming or in mathematics, where pairing "functional" with "flow" would be ambiguous. Here, "functional flow" pertains to the sequencing of operations, with "flow" arrows expressing dependence on the success of prior operations. FFBDs may also express input and output data dependencies between functional blocks, as shown in figures below, but FFBDs primarily focus on sequencing.
 W
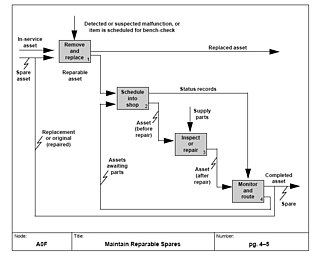
WIDEF, initially an abbreviation of ICAM Definition and renamed in 1999 as Integration Definition, is a family of modeling languages in the field of systems and software engineering. They cover a wide range of uses from functional modeling to data, simulation, object-oriented analysis and design, and knowledge acquisition. These definition languages were developed under funding from U.S. Air Force and, although still most commonly used by them and other military and United States Department of Defense (DoD) agencies, are in the public domain.
 W
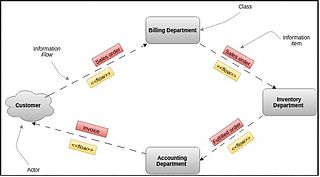
WAn information flow diagram (IFD) is a diagram that shows how information is communicated from a source to a receiver or target, through some medium. The medium acts as a bridge, a means of transmitting the information. Examples of media include word of mouth, radio, email, etc. The concept of IFD was initially used in radio transmission. The diagrammed system may also include feedback, a reply or response to the signal that was given out. The return paths can be two-way or bi-directional: information can flow back and forth.
 W
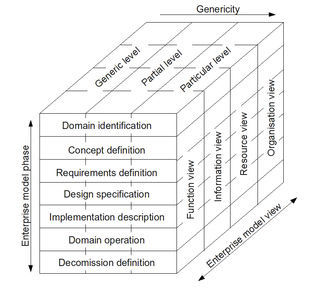
WISO 19439:2006 Enterprise integration—Framework for enterprise modelling, is an international standard for enterprise modelling and enterprise integration developed by the International Organization for Standardization, based on CIMOSA and GERAM.
 W
WObject Process Methodology (OPM) is a conception modeling language and methodology for capturing knowledge and designing systems, specified as ISO/PAS 19450. Based on a minimal universal ontology of stateful objects and processes that transform them, OPM can be used to formally specify the function, structure, and behavior of artificial and natural systems in a large variety of domains.
 W
WObject-role modeling (ORM) is used to model the semantics of a universe of discourse. ORM is often used for data modeling and software engineering.
 W
WA Petri net, also known as a place/transition (PT) net, is one of several mathematical modeling languages for the description of distributed systems. It is a class of discrete event dynamic system. A Petri net is a directed bipartite graph that has two types of elements, places and transitions, depicted as white circles and rectangles, respectively. A place can contain any number of tokens, depicted as black circles. A transition is enabled if all places connected to it as inputs contain at least one token. Some sources state that Petri nets were invented in August 1939 by Carl Adam Petri—at the age of 13—for the purpose of describing chemical processes.
 W
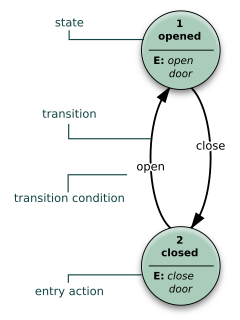
WA state diagram is a type of diagram used in computer science and related fields to describe the behavior of systems. State diagrams require that the system described is composed of a finite number of states; sometimes, this is indeed the case, while at other times this is a reasonable abstraction. Many forms of state diagrams exist, which differ slightly and have different semantics.
 W
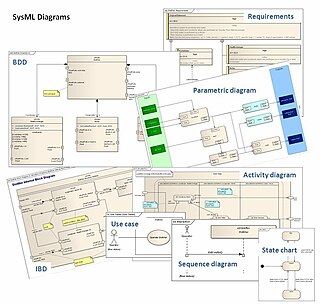
WThe Systems Modeling Language (SysML) is a general-purpose modeling language for systems engineering applications. It supports the specification, analysis, design, verification and validation of a broad range of systems and systems-of-systems.
The Unified Modeling Language (UML) is a general-purpose, developmental, modeling language in the field of software engineering that is intended to provide a standard way to visualize the design of a system.
 W
WThe XML Process Definition Language (XPDL) is a format standardized by the Workflow Management Coalition (WfMC) to interchange business process definitions between different workflow products, i.e. between different modeling tools and management suites. XPDL defines an XML schema for specifying the declarative part of workflow / business process.