 W
WA Web mapping or an online mapping is the process of using the maps delivered by geographic information systems (GIS) on the Internet, more specifically in the World Wide Web (WWW). A web map or an online map is both served and consumed, thus web mapping is more than just web cartography, it is a service by which consumers may choose what the map will show. Web GIS emphasizes geodata processing aspects more involved with design aspects such as data acquisition and server software architecture such as data storage and algorithms, than it does the end-user reports themselves.
 W
WAdmiralty charts are nautical charts issued by the United Kingdom Hydrographic Office (UKHO) and subject to Crown Copyright. Over 3,500 Standard Nautical Charts (SNCs) and 14,000 Electronic Navigational Charts (ENCs) are available with the Admiralty portfolio offering the widest official coverage of international shipping routes and ports, in varying detail.
 W
WAlpine Club maps are specially detailed maps for summer and winter mountain climbers. They are predominantly published at a scale of 1:25.000, although some individual sheets have scales of 1:50.000 and 1:100.000.
 W
WA bathymetric chart is a type of isarithmic map that depicts the submerged topography and physiographic features of ocean and sea bottoms. Their primary purpose is to provide detailed depth contours of ocean topography as well as provide the size, shape and distribution of underwater features. Topographic maps display elevation above ground and are complementary to bathymetric charts. Charts use a series of lines and points at equal intervals to showcase depth or elevation. A closed shape with increasingly smaller shapes inside of it can indicate an ocean trench or a seamount, or underwater mountain, depending on whether the depths increase or decrease going inward.
 W
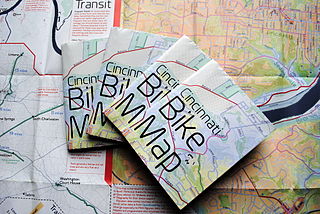
WA bicycle map or bike map is a map designed specifically for bicyclists. Bike maps often include features not on general purpose street maps such as bike lanes, bike paths, bike routes, bike shops, topographical features like major hills, etc. Earlier in the 20th century, bike maps tended to focus on showing pavement quality.
 W
WA cadastral map is a comprehensive land recording of the real estate or real property's metes-and-bounds of a country.
 W
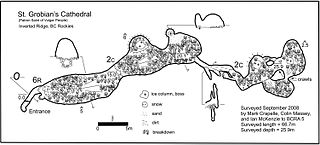
WA cave survey is a map of all or part of a cave system, which may be produced to meet differing standards of accuracy depending on the cave conditions and equipment available underground. Cave surveying and cartography, i.e. the creation of an accurate, detailed map, is one of the most common technical activities undertaken within a cave and is a fundamental part of speleology. Surveys can be used to compare caves to each other by length, depth and volume, may reveal clues on speleogenesis, provide a spatial reference for other areas of scientific study and assist visitors with route-finding.
 W
WA Chorochromatic map, also known as an area-class, qualitative area, or mosaic map, is a type of thematic map that portray regions of categorical or nominal data using variations in color symbols. Chorochromatic maps are typically used to represent discrete fields, also known as categorical coverages. Chorochromatic maps differ from choropleth maps in that chorochromatic maps are mapped according to data-driven boundaries instead of trying to make the data fit within existing, sometimes arbitrary units such as political boundaries.
 W
WA choropleth map is a type of thematic map in which a set of pre-defined areas is colored or patterned in proportion to a statistical variable that represents an aggregate summary of a geographic characteristic within each area, such as population density or per-capita income.
 W
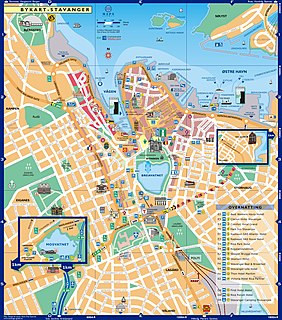
WA city map is a large-scale thematic map of a city created to enable the fastest possible orientation in an urban space. The graphic representation of objects on a city map is therefore usually greatly simplified, and reduced to generally understood symbology.
 W
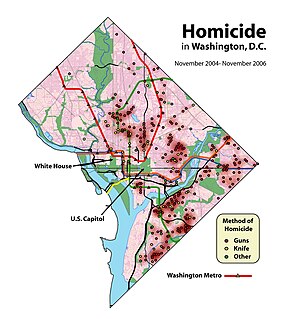
WCrime mapping is used by analysts in law enforcement agencies to map, visualize, and analyze crime incident patterns. It is a key component of crime analysis and the CompStat policing strategy. Mapping crime, using Geographic Information Systems (GIS), allows crime analysts to identify crime hot spots, along with other trends and patterns.
 W
WA dasymetric map is a type of thematic map that uses areal symbols to visualize a geographic field by refining a choropleth map with ancillary information about the distribution of the variable. The name refers to the fact that the most common variable mapped using this technique has generally been population density. The dasymetric map is a hybrid product combining the strengths and weaknesses of choropleth and isarithmic maps.
 W
WA dot distribution map is a type of thematic map that uses a point symbol to visualize the geographic distribution of a large number of related phenomena. Dot maps are a type of unit visualizations that rely on a visual scatter to show spatial patterns, especially variances in density. The dots may represent the actual locations of individual phenomena, or be randomly placed in aggregation districts to represent a number of individuals. Although these two procedures, and their underlying models, are very different, the general effect is the same.
 W
WEstate maps were maps commissioned by individual landowners or institutions, to show their extensive landed property, typically including fields, parkland and buildings. They were used for display and estate management and were fashionable from the 16th to the 19th century.
 W
WA fantasy map is type of map design that is a visual representation of an imaginary or fictional geography. While some fantasy maps accompany works of fiction and are considered fictional maps, fantasy maps are created to show imaginary places and are not necessarily included in works of literary fiction. Depending on the completeness and complexity of the map, the depiction of geographical components can range from simple drawings of a small area as in The Twenty-One Balloons by William Pène du Bois to an entire fictional world as in The Lord of the Rings by Tolkien to even an entire galaxy as in Star Trek. Fantasy maps can also include abstract works of art, combine existing cartographic information to present an imaginary location, or combine existing cartographic information to show a different perspective of a location.
 W
WA figure-ground diagram is a two-dimensional map of an urban space that shows the relationship between built and unbuilt space. It is used in analysis of urban design and planning. It is akin to but not the same as a Nolli map which denotes public space both within and outside buildings and also akin to a block pattern diagram that records public and private property as simple rectangular blocks. The earliest advocates of its use were Colin Rowe and Fred Koetter.
 W
WA flow map is a type of thematic map that uses linear symbols to represent movement. It may thus be considered a hybrid of a map and a flow diagram. The movement being mapped may be that of anything, including people, highway traffic, trade goods, water, ideas, or even telecommunications data. The wide variety of moving material, and the variety of geographic networks through they move, has led to many different design strategies. Some cartographers have expanded this term to any thematic map of a linear network, while others restrict its use to maps that specifically show movement of some kind.
 W
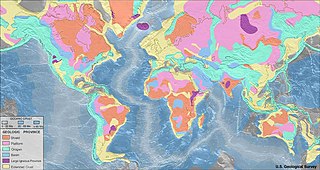
WA geologic map is a special-purpose map made to show various geological features. Rock units or geologic strata are shown by color or symbols. Bedding planes and structural features such as faults, folds, are shown with strike and dip or trend and plunge symbols which give three-dimensional orientations features.
 W
WA globe is a spherical model of Earth, of some other celestial body, or of the celestial sphere. Globes serve purposes similar to maps, but unlike maps, they do not distort the surface that they portray except to scale it down. A model globe of Earth is called a terrestrial globe. A model globe of the celestial sphere is called a celestial globe.
Green Maps are locally created environmentally themed maps with a universal symbol set and map-making resources provided by the non-profit Green Map System. Based on the principles of cartography each Green Map plots the locations of a community's natural, cultural and sustainable resources such as recycling centers, heritage sites, community gardens and socially conscious businesses, as well as hazards and challenges to health and wellbeing. Green Maps have been made in 65 countries.
 W
WHachures are an older mode of representing relief. They show orientation of slope, and by their thickness and overall density they provide a general sense of steepness. Being non-numeric, they are less useful to a scientific survey than contours, but can successfully communicate quite specific shapes of terrain. They are a form of shading, although different from the one used in shaded maps.
 W
WA hazard map is a map that highlights areas that are affected by or are vulnerable to a particular hazard. They are typically created for natural hazards, such as earthquakes, volcanoes, landslides, flooding and tsunamis. Hazard maps help prevent serious damage and deaths.
 W
WA hex map, hex board, or hex grid is a game board design commonly used in wargames of all scales. The map is subdivided into a hexagonal tiling, small regular hexagons of identical size.
 W
WIndex maps are a type of finding aid that enables users to find a set of maps covering their regions of interest along with the name or number of the relevant map sheet. An index map provides geospatial data on either a sheet of paper or a computer screen. In this way, a map acts as a kind of gazetteer, with the location represented within a grid overlaying the map's surface.
 W
WAn isochrone map in geography and urban planning is a map that depicts the area accessible from a point within a certain time threshold. An isochrone is defined as "a line drawn on a map connecting points at which something occurs or arrives at the same time". In hydrology and transportation planning isochrone maps are commonly used to depict areas of equal travel time. The term is also used in cardiology as a tool to visually detect abnormalities using body surface distribution.
 W
WAn isopach map illustrates thickness variations within a tabular unit, layer or stratum. Isopachs are contour lines of equal thickness over an area. Isopach maps are utilized in hydrographic survey, stratigraphy, sedimentology, structural geology, petroleum geology and volcanology.
 W
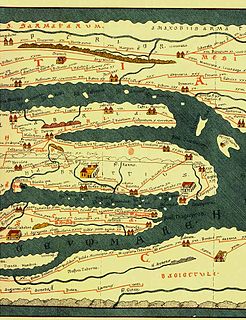
WAn itinerarium was an Ancient Roman road map in the form of a listing of cities, villages (vici) and other stops, with the intervening distances. One surviving example is the Peutinger Table ; another is the Antonine Itinerary.
 W
WThe Itinerarium Burdigalense, also known as the Itinerarium Hierosolymitanum, is the oldest known Christian itinerarium. It was written by the "Pilgrim of Bordeaux", an anonymous pilgrim from the city of Burdigala in the Roman province of Gallia Aquitania.
 W
WA map series is a group of topographic or thematic charts or maps usually having the same scale and cartographic specifications, and with each sheet appropriately identified by its publisher as belonging to the same series.
 W
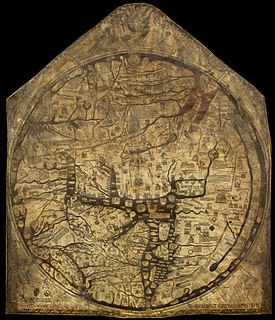
WA mappa mundi is any medieval European map of the world. Such maps range in size and complexity from simple schematic maps 25 millimetres or less across to elaborate wall maps, the largest of which to survive to modern times, the Ebstorf map, was around 3.5 m in diameter. The term derives from the Medieval Latin words mappa and mundus (world).
 W
WMetrominuto is a schematic pedestrian map based on the aesthetics of transit maps, marking the distances between the most important points of a city and the times an average person would take to walk those distances, designed to encourage citizens to get around on foot.
 W
WA bivariate or multivariate map is a type of thematic map that displays two or more variables on a single map by combining different sets of symbols. Each of the variables is represented using a standard thematic map technique, such as choropleth, cartogram, or proportional symbols. They may be the same type or different types, and they may be on separate layers of the map, or they may be combined into a single multivariate symbol.
 W
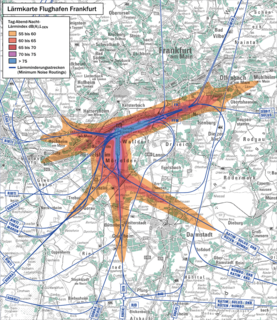
WA noise map is a graphic representation of the sound level distribution and the propagation of sound waves in a given region, for a defined period.
 W
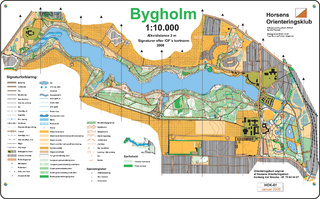
WAn orienteering map is a map specially prepared for use in orienteering competitions. It is a topographic map with extra details to help the competitor navigate through the competition area.
 W
WAn orthophoto, orthophotograph or orthoimage is an aerial photograph or satellite imagery geometrically corrected ("orthorectified") such that the scale is uniform: the photo or image follows a given map projection. Unlike an uncorrected aerial photograph, an orthophoto can be used to measure true distances, because it is an accurate representation of the Earth's surface, having been adjusted for topographic relief, lens distortion, and camera tilt.
 W
WPictorial maps depict a given territory with a more artistic rather than technical style. It is a type of map in contrast to road map, atlas, or topographic map. The cartography can be a sophisticated 3-D perspective landscape or a simple map graphic enlivened with illustrations of buildings, people and animals. They can feature all sorts of varied topics like historical events, legendary figures or local agricultural products and cover anything from an entire continent to a college campus. Drawn by specialized artists and illustrators, pictorial maps are a rich, centuries-old tradition and a diverse art form that ranges from cartoon maps on restaurant placemats to treasured art prints in museums.
 W
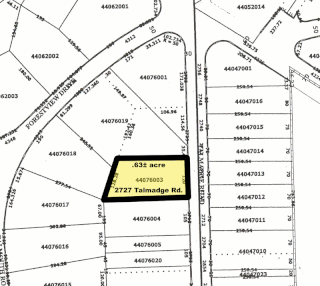
WIn the United States, a plat (plan) is a cadastral map, drawn to scale, showing the divisions of a piece of land. United States General Land Office surveyors drafted township plats of Public Lands Surveys to show the distance and bearing between section corners, sometimes including topographic or vegetation information. City, town or village plats show subdivisions broken into blocks with streets and alleys. Further refinement often splits blocks into individual lots, usually for the purpose of selling the described lots; this has become known as subdivision.
 W
WPortolan charts are nautical charts, first made in the 13th century in the Mediterranean basin and later expanded to include other regions, which have been noted for their high cartographic accuracy. The word portolan comes from the Italian portulano, meaning "related to ports or harbors", and which since at least the 17th century designates "a collection of sailing directions".
 W
WA poverty map is a map which provides a detailed description of the spatial distribution of poverty and inequality within a country. It combines individual and household (micro) survey data and population (macro) census data with the objective of estimating welfare indicators for specific geographic area as small as village or hamlet.
 W
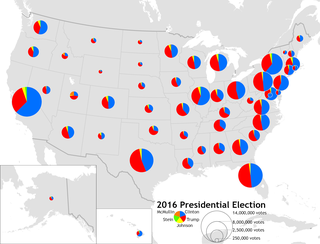
WA proportional symbol map or proportional point symbol map is a type of thematic map that uses map symbols that vary in size to represent a quantitative variable. For example, circles may be used to show the location of cities within the map, with the size of each circle sized proportionally to the population of the city. Typically, the size of each symbol is calculated so that its area is mathematically proportional to the variable, but more indirect methods are also used.
 W
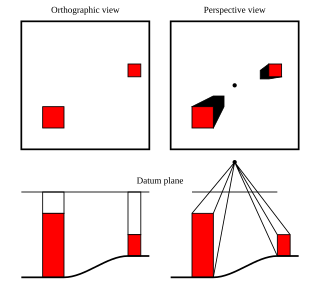
WA raised-relief map or terrain model is a three-dimensional representation, usually of terrain, materialized as a physical artifact. When representing terrain, the vertical dimension is usually exaggerated by a factor between five and ten; this facilitates the visual recognition of terrain features.
 W
WA road map, route map, or street map is a map that primarily displays roads and transport links rather than natural geographical information. It is a type of navigational map that commonly includes political boundaries and labels, making it also a type of political map. In addition to roads and boundaries, road maps often include points of interest, such as prominent businesses or buildings, tourism sites, parks and recreational facilities, hotels and restaurants, as well as airports and train stations. A road map may also document non-automotive transit routes, although often these are found only on transit maps.
 W
WIn United States aviation, a sectional chart, often called sectional for short, is a type of aeronautical chart designed for navigation under visual flight rules.
 W
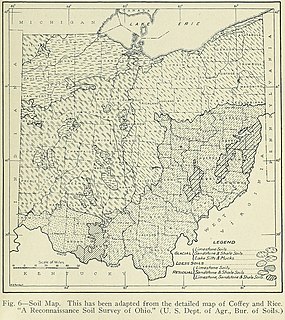
WSoil map is a geographical representation showing diversity of soil types and/or soil properties in the area of interest. It is typically the end result of a soil survey inventory, i.e. soil survey. Soil maps are most commonly used for land evaluation, spatial planning, agricultural extension, environmental protection and similar projects. Traditional soil maps typically show only general distribution of soils, accompanied by the soil survey report. Many new soil maps are derived using digital soil mapping techniques. Such maps are typically richer in context and show higher spatial detail than traditional soil maps. Soil maps produced using (geo)statistical techniques also include an estimate of the model uncertainty.
 W
WSouth-up map orientation is the orientation of a map with south up, or at the top of the map, amounting to a 180-degree rotation of the map from the standard convention of north-up. Maps in this orientation are sometimes called upside down maps or reversed maps.
 W
WA star chart or star map, also called a sky chart or sky map, is a map of the night sky. Astronomers divide these into grids to use them more easily. They are used to identify and locate constellations and astronomical objects such as stars, nebulae, and galaxies. They have been used for human navigation since time immemorial. Note that a star chart differs from an astronomical catalog, which is a listing or tabulation of astronomical objects for a particular purpose. Tools utilizing a star chart include the astrolabe and planisphere.
 W
WA straight-line diagram is a diagram of a road where the road is shown as a straight line. Such diagrams are usually produced by a highway department, and display features along the road, including bridges and intersecting roads. Rows below the diagram show data about the road, usually including speed limit, number of lanes, bridge numbers, and historical data, among other data. Subway lines also frequently employ straight-line diagrams.
 W
WA T and O map or O–T or T–O map, also known as an Isidoran map, is a type of early world map that represents the physical world as first described by the 7th-century scholar Isidore of Seville in his De Natura Rerum and later his Etymologiae.
WA thematic map is a type of map that portrays the geographic pattern of a particular subject matter (theme) in a geographic area. This usually involves the use of map symbols to visualize selected properties of geographic features that are not naturally visible, such as temperature, language, or population. In this, they contrast with general reference maps, which focus on the location of a diverse set of physical features, such as rivers, roads, and buildings. Alternative names have been suggested for this class, such as special-subject or special-purpose maps, statistical maps, or distribution maps, but these have generally fallen out of common usage. Thematic mapping is closely allied with the field of Geovisualization.
 W
WThe term tithe map is usually applied to a map of an English or Welsh parish or township, prepared following the Tithe Commutation Act 1836. This act allowed tithes to be paid in cash rather than goods. The map and its accompanying schedule gave the names of all owners and occupiers of land in the parish. Individual tithe owners sometimes prepared maps for their own use to show who owned what land. These maps are sometimes also called tithe maps, although such maps are not common before 1836.
 W
WTopography concerns with the shape and character of the Earth's surface, and maps were among the first artifacts to record these observations. In modern mapping, a topographic map or topographic sheet is a type of map characterized by large-scale detail and quantitative representation of relief features, usually using contour lines, but historically using a variety of methods. Traditional definitions require a topographic map to show both natural and artificial features. A topographic survey is typically based upon systematic observation and published as a map series, made up of two or more map sheets that combine to form the whole map. A topographic map series uses a common specification that includes the range of cartographic symbols employed, as well as a standard geodetic framework that defines the map projection, coordinate system, ellipsoid and geodetic datum. Official topographic maps also adopt a national grid referencing system.
 W
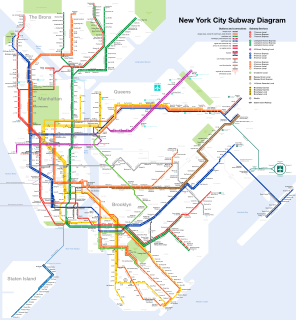
WA transit map is a topological map in the form of a schematic diagram used to illustrate the routes and stations within a public transport system—whether this be bus, tram, rapid transit, commuter rail or ferry routes. The main components are color-coded lines to indicate each route or service, with named icons to indicate stations or stops.
 W
WA treasure map is a map that marks the location of buried treasure, a lost mine, a valuable secret or a hidden locale. More common in fiction than in reality, "pirate treasure maps" are often depicted in works of fiction as hand drawn and containing arcane clues for the characters to follow. Regardless of the term's literary use, anything that meets the broad definition of a "map" that describes the location of a "treasure" could appropriately be called a "treasure map."
 W
WThe Tube map is a schematic transport map of the lines, stations and services of the London Underground, known colloquially as "the Tube", hence the map's name. The first schematic Tube map was designed by Harry Beck in 1931. Since then, it has been expanded to include more of London's public transport systems, including the Docklands Light Railway, London Overground, TfL Rail, Tramlink, the Emirates Air Line cable car and Thameslink.
 W
WA virtual globe is a three-dimensional (3D) software model or representation of the Earth or another world. A virtual globe provides the user with the ability to freely move around in the virtual environment by changing the viewing angle and position. Compared to a conventional globe, virtual globes have the additional capability of representing many different views on the surface of the Earth. These views may be of geographical features, man-made features such as roads and buildings, or abstract representations of demographic quantities such as population.
 W
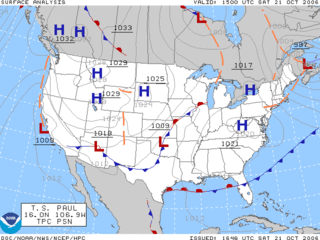
WA weather map, also known as synoptic weather chart, displays various meteorological features across a particular area at a particular point in time and has various symbols which all have specific meanings. Such maps have been in use since the mid-19th century and are used for research and weather forecasting purposes. Maps using isotherms show temperature gradients, which can help locate weather fronts. Isotach maps, analyzing lines of equal wind speed, on a constant pressure surface of 300 or 250 hPa show where the jet stream is located. Use of constant pressure charts at the 700 and 500 hPa level can indicate tropical cyclone motion. Two-dimensional streamlines based on wind speeds at various levels show areas of convergence and divergence in the wind field, which are helpful in determining the location of features within the wind pattern. A popular type of surface weather map is the surface weather analysis, which plots isobars to depict areas of high pressure and low pressure. Cloud codes are translated into symbols and plotted on these maps along with other meteorological data that are included in synoptic reports sent by professionally trained observers.
 W
WA World Aeronautical Chart (WAC) is a type of aeronautical chart used for navigation by pilots of moderate speed aircraft and aircraft at high altitudes. They are at a scale of 1:1,000,000.