 W
WA bond graph is a graphical representation of a physical dynamic system. It allows the conversion of the system into a state-space representation. It is similar to a block diagram or signal-flow graph, with the major difference that the arcs in bond graphs represent bi-directional exchange of physical energy, while those in block diagrams and signal-flow graphs represent uni-directional flow of information. Bond graphs are multi-energy domain and domain neutral. This means a bond graph can incorporate multiple domains seamlessly.
 W
WIn mathematics, a Cayley graph, also known as a Cayley colour graph, Cayley diagram, group diagram, or colour group is a graph that encodes the abstract structure of a group. Its definition is suggested by Cayley's theorem and uses a specified, usually finite, set of generators for the group. It is a central tool in combinatorial and geometric group theory.
 W
WA conceptual graph (CG) is a formalism for knowledge representation. In the first published paper on CGs, John F. Sowa used them to represent the conceptual schemas used in database systems. The first book on CGs applied them to a wide range of topics in artificial intelligence, computer science, and cognitive science.
 W
WIn computer science, a control-flow graph (CFG) is a representation, using graph notation, of all paths that might be traversed through a program during its execution. The control-flow graph is due to Frances E. Allen, who notes that Reese T. Prosser used boolean connectivity matrices for flow analysis before.
 W
WA flip graph is a graph whose vertices are combinatorial or geometric objects, and whose edges link two of these objects when they can be obtained from one another by an elementary operation called a flip. Flip graphs are special cases of geometric graphs.
 W
WIn mathematical logic, an implication graph is a skew-symmetric directed graph G = composed of vertex set V and directed edge set E. Each vertex in V represents the truth status of a Boolean literal, and each directed edge from vertex u to vertex v represents the material implication "If the literal u is true then the literal v is also true". Implication graphs were originally used for analyzing complex Boolean expressions.
 W
WIngredient-flavor networks are networks describing the sharing of flavor compounds of culinary ingredients. In the bipartite form, an ingredient-flavor network consist of two different types of nodes: the ingredients used in the recipes and the flavor compounds that contributes to the flavor of each ingredients. The links connecting different types of nodes are undirected, represent certain compound occur in each ingredients. The ingredient-flavor network can also be projected in the ingredient or compound space where nodes are ingredients or compounds, links represents the sharing of the same compounds to different ingredients or the coexistence in the same ingredient of different compounds.
 W
WIn chemical graph theory and in mathematical chemistry, a molecular graph or chemical graph is a representation of the structural formula of a chemical compound in terms of graph theory. A chemical graph is a labeled graph whose vertices correspond to the atoms of the compound and edges correspond to chemical bonds. Its vertices are labeled with the kinds of the corresponding atoms and edges are labeled with the types of bonds. For particular purposes any of the labelings may be ignored.
 W
WA pollination network is a bipartite mutualistic network in which plants and pollinators are the nodes, and the pollination interactions form the links between these nodes. The pollination network is bipartite as interactions only exist between two distinct, non-overlapping sets of species, but not within the set: a pollinator can never be pollinated, unlike in a predator-prey network where a predator can be depredated. A pollination network is two-modal, i.e., it includes only links connecting plant and animal communities.
 W
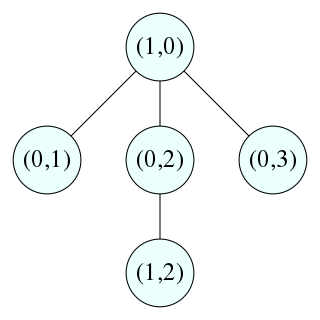
WA Reeb graph is a mathematical object reflecting the evolution of the level sets of a real-valued function on a manifold. According to a similar concept was introduced by G.M. Adelson-Velskii and A.S. Kronrod and applied to analysis of Hilbert's thirteenth problem. Proposed by G. Reeb as a tool in Morse theory, Reeb graphs are the natural tool to study multivalued functional relationships between 2D scalar fields , , and arising from the conditions and , because these relationships are single-valued when restricted to a region associated with an individual edge of the Reeb graph. This general principle was first used to study neutral surfaces in oceanography.
 W
WA spatial network is a graph in which the vertices or edges are spatial elements associated with geometric objects, i.e. the nodes are located in a space equipped with a certain metric. The simplest mathematical realization is a lattice or a random geometric graph, where nodes are distributed uniformly at random over a two-dimensional plane; a pair of nodes are connected if the Euclidean distance is smaller than a given neighborhood radius. Transportation and mobility networks, Internet, mobile phone networks, power grids, social and contact networks and biological neural networks are all examples where the underlying space is relevant and where the graph's topology alone does not contain all the information. Characterizing and understanding the structure, resilience and the evolution of spatial networks is crucial for many different fields ranging from urbanism to epidemiology.
 W
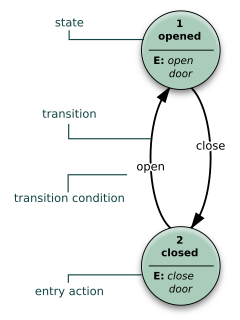
WA state diagram is a type of diagram used in computer science and related fields to describe the behavior of systems. State diagrams require that the system described is composed of a finite number of states; sometimes, this is indeed the case, while at other times this is a reasonable abstraction. Many forms of state diagrams exist, which differ slightly and have different semantics.
 W
WIn the mathematics of Sudoku, the Sudoku graph is an undirected graph whose vertices represent the cells of a (blank) Sudoku puzzle and whose edges represent pairs of cells that belong to the same row, column, or block of the puzzle. The problem of solving a Sudoku puzzle can be represented as precoloring extension on this graph. It is an integral Cayley graph.
 W
WIn strategy computer games, a technology, tech, or research tree is a hierarchical visual representation of the possible sequences of upgrades a player can take. Because these trees are technically directed and acyclic, they can more accurately be described as a technology directed acyclic graph. The diagram is tree-shaped in the sense that it branches between each 'level', allowing the player to choose one sequence or another. Each level is called a tier and is often used to describe the technological strength of a player. Typically, at the beginning of a session of a strategy game, a player will start at tier 1, and will only have a few options for technologies to research. Each technology that a player researches will open up one or more new options, but may or may not, depending on the computer game, close off the paths to other options. The tech tree is the representation of all possible paths of research a player can take, up to the culmination of said sequence.
 W
WIn mathematics, trace diagrams are a graphical means of performing computations in linear and multilinear algebra. They can be represented as graphs in which some edges are labeled by matrices. The simplest trace diagrams represent the trace and determinant of a matrix. Several results in linear algebra, such as Cramer's Rule and the Cayley–Hamilton theorem, have simple diagrammatic proofs. They are closely related to Penrose's graphical notation.
 W
WA trellis is a graph whose nodes are ordered into vertical slices (time) with each node at each time connected to at least one node at an earlier and at least one node at a later time. The earliest and latest times in the trellis have only one node.
 W
WA wait-for graph in computer science is a directed graph used for deadlock detection in operating systems and relational database systems.
 W
WIn mathematics, and more specifically in combinatorial commutative algebra, a zero-divisor graph is an undirected graph representing the zero divisors of a commutative ring. It has elements of the ring as its vertices, and pairs of elements whose product is zero as its edges.