 W
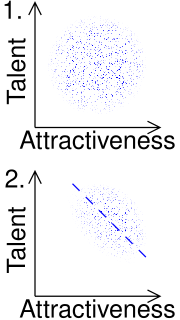
WBerkson's paradox, also known as Berkson's bias, collider bias or Berkson's fallacy, is a result in conditional probability and statistics which is often found to be counterintuitive, and hence a veridical paradox. It is a complicating factor arising in statistical tests of proportions. Specifically, it arises when there is an ascertainment bias inherent in a study design. The effect is related to the explaining away phenomenon in Bayesian networks, and conditioning on a collider in graphical models.
 W
WA Bland–Altman plot in analytical chemistry or biomedicine is a method of data plotting used in analyzing the agreement between two different assays. It is identical to a Tukey mean-difference plot, the name by which it is known in other fields, but was popularised in medical statistics by J. Martin Bland and Douglas G. Altman.
 W
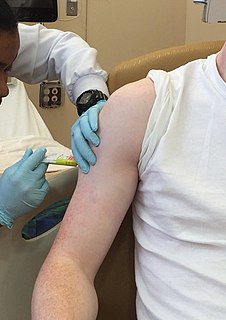
WClinical trials are experiments or observations done in clinical research. Such prospective biomedical or behavioral research studies on human participants are designed to answer specific questions about biomedical or behavioral interventions, including new treatments and known interventions that warrant further study and comparison. Clinical trials generate data on safety and efficacy. They are conducted only after they have received health authority/ethics committee approval in the country where approval of the therapy is sought. These authorities are responsible for vetting the risk/benefit ratio of the trial—their approval does not mean the therapy is 'safe' or effective, only that the trial may be conducted.
 W
WThe Diagnostic and Statistical Manual of Mental Disorders is a publication by the American Psychiatric Association (APA) for the classification of mental disorders using a common language and standard criteria.
 W
WIn medical testing with binary classification, the diagnostic odds ratio (DOR) is a measure of the effectiveness of a diagnostic test. It is defined as the ratio of the odds of the test being positive if the subject has a disease relative to the odds of the test being positive if the subject does not have the disease.
 W
WHeart rate variability (HRV) is the physiological phenomenon of variation in the time interval between heartbeats. It is measured by the variation in the beat-to-beat interval.
 W
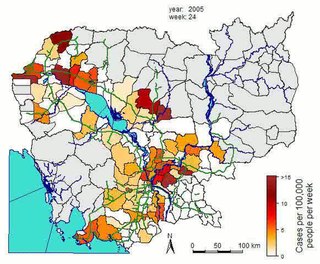
WIncidence in epidemiology is a measure of the probability of occurrence of a given medical condition in a population within a specified period of time. Although sometimes loosely expressed simply as the number of new cases during some time period, it is better expressed as a proportion or a rate with a denominator.
 W
WLength time bias is an overestimation of survival duration due to the relative excess of cases detected that are asymptomatically slowly progressing, while fast progressing cases are detected after giving symptoms. It is a form of selection bias, a statistical distortion of results that can lead to incorrect conclusions about factual data. While the raw data of a study may itself be objective and independent, statistical analysis requires parametric inputs of frequency and length of time, which is some arbitrary choice of design originating in the statistician and not the data. If points are chosen randomly in an attempt to prevent observer selection bias, this choice of method itself amounts to a grand bias, because longer or more complex intervals increase possibilities for false detection of significance.
 W
WMortality rate, or death rate, is a measure of the number of deaths in a particular population, scaled to the size of that population, per unit of time. Mortality rate is typically expressed in units of deaths per 1,000 individuals per year; thus, a mortality rate of 9.5 in a population of 1,000 would mean 9.5 deaths per year in that entire population, or 0.95% out of the total. It is distinct from "morbidity", which is either the prevalence or incidence of a disease, and also from the incidence rate.
 W
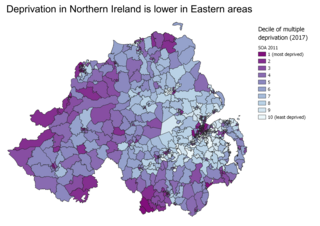
WIndices of multiple deprivation (IMD) are widely-used datasets within the UK to classify the relative deprivation of small areas. Multiple components of deprivation are weighted with different strengths and compiled into a single score of deprivation.
 W
WIn medicine, the number needed to harm (NNH) is an epidemiological measure that indicates how many persons on average need to be exposed to a risk factor over a specific period to cause harm in an average of one person who would not otherwise have been harmed. It is defined as the inverse of the absolute risk increase, and computed as , where is the incidence in the treated (exposed) group, and is the incidence in the control (unexposed) group. Intuitively, the lower the number needed to harm, the worse the risk factor, with 1 meaning that every exposed person is harmed.
 W
WThe number needed to treat (NNT) is an epidemiological measure used in communicating the effectiveness of a health-care intervention, typically a treatment with medication. The NNT is the average number of patients who need to be treated to prevent one additional bad outcome. It is defined as the inverse of the absolute risk reduction, and computed as , where is the incidence in the treated (exposed) group, and is the incidence in the control (unexposed) group.
WThe relative risk (RR) or risk ratio is the ratio of the probability of an outcome in an exposed group to the probability of an outcome in an unexposed group. Together with risk difference and odds ratio, relative risk measures the association between the exposure and the outcome.
WIn epidemiology, the relative risk reduction (RRR) or efficacy is the relative decrease in the risk of an adverse event in the exposed group compared to an unexposed group. It is computed as , where is the incidence in the exposed group, and is the incidence in the unexposed group. If the risk of an adverse event is increased by the exposure rather than decreased, term relative risk increase (RRI) is used, and computed as . If the direction of risk change is not assumed, a term relative effect is used and computed as .
WThe risk difference (RD), excess risk, or attributable risk is the difference between the risk of an outcome in the exposed group and the unexposed group. It is computed as , where is the incidence in the exposed group, and is the incidence in the unexposed group. If the risk of an outcome is increased by the exposure, the term absolute risk increase (ARI) is used, and computed as . Equivalently, if the risk of an outcome is decreased by the exposure, the term absolute risk reduction (ARR) is used, and computed as .
 W
WIn statistical analysis, the rule of three states that if a certain event did not occur in a sample with n subjects, the interval from 0 to 3/n is a 95% confidence interval for the rate of occurrences in the population. When n is greater than 30, this is a good approximation of results from more sensitive tests. For example, a pain-relief drug is tested on 1500 human subjects, and no adverse event is recorded. From the rule of three, it can be concluded with 95% confidence that fewer than 1 person in 500 will experience an adverse event. By symmetry, for only successes, the 95% confidence interval is [1−3/n,1].
 W
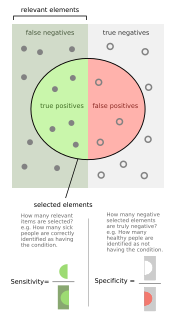
WSensitivity and specificity are statistical measures of the performance of a binary classification test that are widely used in medicine:Sensitivity measures the proportion of positives that are correctly identified. Specificity measures the proportion of negatives that are correctly identified.
 W
WA smart thermometer is a medical thermometer which is able to transmit its readings so that they can be collected, stored and analysed.
 W
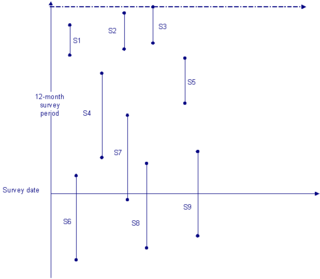
WStock sampling is sampling people in a certain state at the time of the survey. This is in contrast to flow sampling, where the relationship of interest deals with duration or survival analysis. In stock sampling, rather than focusing on transitions within a certain time interval, we only have observations at a certain point in time. This can lead to both left and right censoring. Imposing the same model on data that have been generated under the two different sampling regimes can lead to research reaching fundamentally different conclusions if the joint distribution across the flow and stock samples differ sufficiently.