 W
WFityk is a curve fitting and data analysis application, predominantly used to fit analytical, bell-shaped functions to experimental data. It is positioned to fill the gap between general plotting software and programs specific for one field, e.g. crystallography or XPS.
 W
Wggplot2 is a data visualization package for the statistical programming language R. Created by Hadley Wickham in 2005, ggplot2 is an implementation of Leland Wilkinson's Grammar of Graphics—a general scheme for data visualization which breaks up graphs into semantic components such as scales and layers. ggplot2 can serve as a replacement for the base graphics in R and contains a number of defaults for web and print display of common scales. Since 2005, ggplot2 has grown in use to become one of the most popular R packages. It is licensed under GNU GPL v2.
 W
Wgnuplot is a command-line program that can generate two- and three-dimensional plots of functions, data, and data fits. The program runs on all major computers and operating systems . It is a program with a fairly long history, dating back to 1986. Despite its name, this software is not part of the GNU Project.
 W
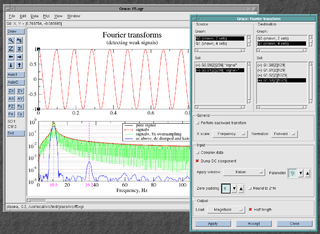
WGrace is a free WYSIWYG 2D graph plotting tool, for Unix-like operating systems. The package name stands for "GRaphing, Advanced Computation and Exploration of data." Grace uses the X Window System and Motif for its GUI. It has been ported to VMS, OS/2, and Windows 9*/NT/2000/XP. In 1996, Linux Journal described Xmgr as one of the two most prominent graphing packages for Linux.
 W
WGraphCalc is an open-source computer program that runs in Microsoft Windows and Linux that provides the functionality of a graphing calculator.
 W
WGraphics Layout Engine (GLE) is a graphics scripting language designed for creating publication quality graphs, plots, diagrams, figures and slides. GLE supports various graph types such as function plots, histograms, bar graphs, scatter plots, contour lines, color maps and surface plots through a simple but flexible set of graphing commands. More complex output can be created by relying on GLE's scripting language, which is full featured with subroutines, variables, and logic control. GLE relies on LaTeX for text output and supports mathematical formula in graphs and figures. GLE's output formats include EPS, PS, PDF, JPEG, and PNG.
gretl is an open-source statistical package, mainly for econometrics. The name is an acronym for Gnu Regression, Econometrics and Time-series Library.
 W
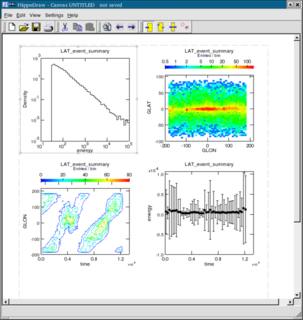
WHippoDraw is a object-oriented statistical data analysis package written in C++, with user interaction via a Qt-based GUI and a Python-scriptable interface. It is being developed by Paul Kunz at SLAC, primarily for the analysis and presentation of particle physics and astrophysics data, but can be equally well used in other fields where data handling is important.
 W
WJFreeChart is an open-source framework for the programming language Java, which allows the creation of a wide variety of both interactive and non-interactive charts.
 W
WKst is a plotting and data viewing program. It is a general purpose plotting software program that evolved out of a need to visualize and analyze astronomical data, but has also found subsequent use in the real time display of graphical information. Kst is a KDE application and is freely available for anyone to download and use under the terms of the GPL. It is noted for being able to graph real-time data acquisition.
 W
WLabPlot is a free software and cross-platform computer program for interactive scientific graphing and data analysis, written for the KDE desktop. It is similar to Origin and is able to import Origin's data files.
 W
WMatplotlib is a plotting library for the Python programming language and its numerical mathematics extension NumPy. It provides an object-oriented API for embedding plots into applications using general-purpose GUI toolkits like Tkinter, wxPython, Qt, or GTK+. There is also a procedural "pylab" interface based on a state machine, designed to closely resemble that of MATLAB, though its use is discouraged. SciPy makes use of Matplotlib.
 W
WMayaVi is a scientific data visualizer written in Python, which uses VTK and provides a GUI via Tkinter. MayaVi was developed by Prabhu Ramachandran, is free and distributed under the BSD License. It is cross-platform and runs on any platform where both Python and VTK are available. MayaVi is pronounced as a single name, "Ma-ya-vee", meaning "magical" in Sanskrit. The code of MayaVi has nothing in common with that of Autodesk Maya or the Vi text editor.
Orange is an open-source data visualization, machine learning and data mining toolkit. It features a visual programming front-end for explorative rapid qualitative data analysis and interactive data visualization.
 W
WPloticus is a free, open-source (GPL) computer program for producing plots and charts from data. It runs under Unix, Solaris, Mac OS X, Linux and Win32 systems. Community support is customarily done through Yahoo News Groups.
 W
WPLplot is a library of subroutines that are often used to make scientific plots in compiled languages such as C, C++, D, Fortran, Ada, OCaml and Java. PLplot can also be used interactively by interpreted languages such as Octave, Python, Perl and Tcl. The current version was written primarily by Maurice J. LeBrun and Geoffrey Furnish.
 W
WR is a programming language and free software environment for statistical computing and graphics supported by the R Foundation for Statistical Computing. The R language is widely used among statisticians and data miners for developing statistical software and data analysis. Polls, data mining surveys, and studies of scholarly literature databases show substantial increases in popularity; as of September 2020, R ranks 9th in the TIOBE index, a measure of popularity of programming languages.
ROOT is an object-oriented program and library developed by CERN. It was originally designed for particle physics data analysis and contains several features specific to this field, but it is also used in other applications such as astronomy and data mining. The latest release is 6.22.00, as of 2020-07-02.
 W
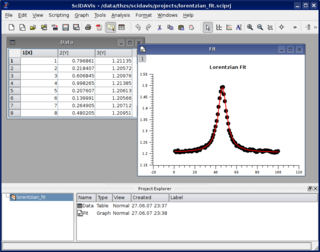
WSciDAVis is an open-source cross-platform computer program for interactive scientific graphing and data analysis. Development started in 2007 as fork of QtiPlot, which in turn is a clone of the proprietary program Origin.
 W
WTOPCAT is an interactive graphical viewer and editor for tabular data. Although a general purpose tool capable of handling large and sparse datasets with correlation functionality its specialist application area is astronomy and it was initially designed to support virtual observatories. It is able to handle several digital file formats including FITS which is in common use in astronomy. The Acronym TOPCAT derives from Tool for OPerations on Catalogues And Tables.
 W
WVeusz is a scientific plotting package. Veusz is a Qt application written in Python, PyQt and NumPy. It is freely available for anyone to distribute under the terms of the GPL. It is designed to produce publication-quality plots. The name should be pronounced as "views".
 W
WVisIt is an open-source interactive parallel visualization and graphical analysis tool for viewing scientific data. It can be used to visualize scalar and vector fields defined on 2D and 3D structured and unstructured meshes. VisIt was designed to handle very large data set sizes in the terascale range and yet can also handle small data sets in the kilobyte range.