 W
WIn mathematics, graph theory is the study of graphs, which are mathematical structures used to model pairwise relations between objects. A graph in this context is made up of vertices which are connected by edges. A distinction is made between undirected graphs, where edges link two vertices symmetrically, and directed graphs, where edges link two vertices asymmetrically; see Graph for more detailed definitions and for other variations in the types of graph that are commonly considered. Graphs are one of the prime objects of study in discrete mathematics.
 W
WIn graph theory and network analysis, indicators of centrality identify the most important vertices within a graph. Applications include identifying the most influential person(s) in a social network, key infrastructure nodes in the Internet or urban networks, and super-spreaders of disease. Centrality concepts were first developed in social network analysis, and many of the terms used to measure centrality reflect their sociological origin. They should not be confused with node influence metrics, which seek to quantify the influence of every node in the network.
 W
WIn graph theory, graph coloring is a special case of graph labeling; it is an assignment of labels traditionally called "colors" to elements of a graph subject to certain constraints. In its simplest form, it is a way of coloring the vertices of a graph such that no two adjacent vertices are of the same color; this is called a vertex coloring. Similarly, an edge coloring assigns a color to each edge so that no two adjacent edges are of the same color, and a face coloring of a planar graph assigns a color to each face or region so that no two faces that share a boundary have the same color.
WIn metric graph theory, a convex subgraph of an undirected graph G is a subgraph that includes every shortest path in G between two of its vertices. Thus, it is analogous to the definition of a convex set in geometry, a set that contains the line segment between every pair of its points.
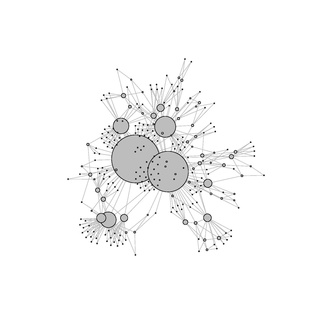
WCopying network models are network generation models that use a copying mechanism to form a network, by repeatedly duplicating and mutating existing nodes of the network. Such a network model has first been proposed in 1999 to explain the network of links between web pages, but since has been used to model biological and citation networks as well.
 W
WIn graph theory, the degree of a vertex of a graph is the number of edges that are incident to the vertex, and in a multigraph, loops are counted twice. The degree of a vertex is denoted or . The maximum degree of a graph , denoted by , and the minimum degree of a graph, denoted by , are the maximum and minimum degree of its vertices. In the multigraph on the right, the maximum degree is 5 and the minimum degree is 0.
WIn the study of graphs and networks, the degree of a node in a network is the number of connections it has to other nodes and the degree distribution is the probability distribution of these degrees over the whole network.
 W
WIn computer science the notion of highly connected subgraphs appears frequently. This notion can be formalized as follows. Let be an undirected graph and let be a subgraph of . Then the density of is defined to be .
 W
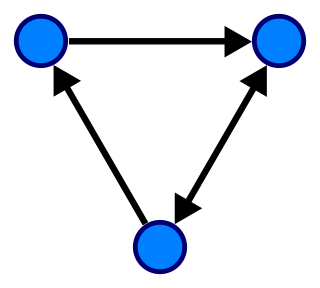
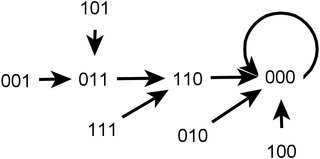
WIn mathematics, and more specifically in graph theory, a directed graph is a graph that is made up of a set of vertices connected by edges, where the edges have a direction associated with them.
 W
WDistinctiveness centrality is a network centrality measure, used in graph analysis. It is similar to degree centrality, but weighted in order to attribute higher importance to distinctive, non-redundant, connections.
 W
WIn computer science, in control flow graphs, a node d dominates a node n if every path from the entry node to n must go through d. Notationally, this is written as d dom n. By definition, every node dominates itself.
 W
WThis classical, popular puzzle involves a large rectangle divided into five "rooms". The objective of the puzzle is to cross each "wall" of the diagram with a continuous line only once.
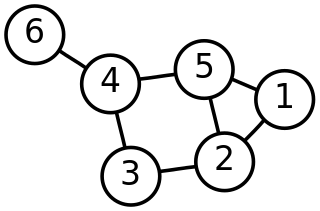
WIn graph theory, a discipline within mathematics, the frequency partition of a graph is a partition of its vertices grouped by their degree. For example, the degree sequence of the left-hand graph below is and its frequency partition is 6 = 3 + 2 + 1. This indicates that it has 3 vertices with some degree, 2 vertices with some other degree, and 1 vertex with a third degree. The degree sequence of the bipartite graph in the middle below is and its frequency partition is 9 = 5 + 3 + 1. The degree sequence of the right-hand graph below is and its frequency partition is 7 = 6 + 1.
WIn computer science, a graph is an abstract data type that is meant to implement the undirected graph and directed graph concepts from the field of graph theory within mathematics.
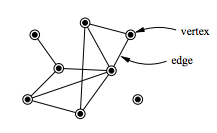
WIn mathematics, and more specifically in graph theory, a graph is a structure amounting to a set of objects in which some pairs of the objects are in some sense "related". The objects correspond to mathematical abstractions called vertices and each of the related pairs of vertices is called an edge. Typically, a graph is depicted in diagrammatic form as a set of dots or circles for the vertices, joined by lines or curves for the edges. Graphs are one of the objects of study in discrete mathematics.
 W
WIn graph theory, Graph equations are equations in which the unknowns are graphs. One of the central questions of graph theory concerns the notion of isomorphism. We ask: When are two graphs the same? The graphs in question may be expressed differently in terms of graph equations.
 W
WIn the mathematical field of graph theory, a graph homomorphism is a mapping between two graphs that respects their structure. More concretely, it is a function between the vertex sets of two graphs that maps adjacent vertices to adjacent vertices.
 W
WIn graph theory, an isomorphism of graphs G and H is a bijection between the vertex sets of G and H
WIn graph theory, a graph property or graph invariant is a property of graphs that depends only on the abstract structure, not on graph representations such as particular labellings or drawings of the graph.
 W
WGraph Theory, 1736–1936 is a book in the history of mathematics on graph theory. It focuses on the foundational documents of the field, beginning with the 1736 paper of Leonhard Euler on the Seven Bridges of Königsberg and ending with the first textbook on the subject, published in 1936 by Dénes Kőnig. Graph Theory, 1736–1936 was edited by Norman L. Biggs, E. Keith Lloyd, and Robin J. Wilson, and published in 1976 by the Clarendon Press. The Oxford University Press published a paperback second edition in 1986, with a corrected reprint in 1998.
 W
WIn graph theory and statistics, a graphon is a symmetric measurable function , that is important in the study of dense graphs. Graphons arise both as a natural notion for the limit of a sequence of dense graphs, and as the fundamental defining objects of exchangeable random graph models. Graphons are tied to dense graphs by the following pair of observations: the random graph models defined by graphons give rise to dense graphs almost surely, and, by the regularity lemma, graphons capture the structure of arbitrary large dense graphs.
 W
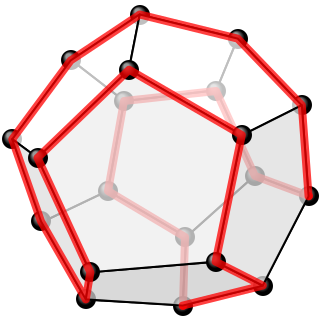
WThe icosian game is a mathematical game invented in 1857 by William Rowan Hamilton. The game's object is finding a Hamiltonian cycle along the edges of a dodecahedron such that every vertex is visited a single time, and the ending point is the same as the starting point. The puzzle was distributed commercially as a pegboard with holes at the nodes of the dodecahedral graph and was subsequently marketed in Europe in many forms.
 W
WIn graph theory, a loop is an edge that connects a vertex to itself. A simple graph contains no loops.
 W
WA Markov chain is a stochastic model describing a sequence of possible events in which the probability of each event depends only on the state attained in the previous event. A countably infinite sequence, in which the chain moves state at discrete time steps, gives a discrete-time Markov chain (DTMC). A continuous-time process is called a continuous-time Markov chain (CTMC). It is named after the Russian mathematician Andrey Markov.
 W
WIn the scale-free network theory, a mediation-driven attachment (MDA) model appears to embody a preferential attachment rule tacitly rather than explicitly. According to MDA rule, a new node first picks a node from the existing network at random and connect itself not with that but with one of the neighbors also picked at random.
 W
WNetwork theory is the study of graphs as a representation of either symmetric relations or asymmetric relations between discrete objects. In computer science and network science, network theory is a part of graph theory: a network can be defined as a graph in which nodes and/or edges have attributes.
WIn mathematics, random graph is the general term to refer to probability distributions over graphs. Random graphs may be described simply by a probability distribution, or by a random process which generates them. The theory of random graphs lies at the intersection between graph theory and probability theory. From a mathematical perspective, random graphs are used to answer questions about the properties of typical graphs. Its practical applications are found in all areas in which complex networks need to be modeled – many random graph models are thus known, mirroring the diverse types of complex networks encountered in different areas. In a mathematical context, random graph refers almost exclusively to the Erdős–Rényi random graph model. In other contexts, any graph model may be referred to as a random graph.
 W
WThe Semantic Brand Score is a measure designed to assess the importance of one or more brands, in different contexts and whenever textual data is available. This metric has its foundations in graph theory and combines methods of text mining and social network analysis. The Semantic Brand Score was developed based on the conceptualizations of brand equity proposed by Keller and Aaker. These well-known models inspired the measurement of a different construct on textual data: brand importance.
 W
WSequential dynamical systems (SDSs) are a class of graph dynamical systems. They are discrete dynamical systems which generalize many aspects of for example classical cellular automata, and they provide a framework for studying asynchronous processes over graphs. The analysis of SDSs uses techniques from combinatorics, abstract algebra, graph theory, dynamical systems and probability theory.
 W
WThe Seven Bridges of Königsberg is a historically notable problem in mathematics. Its negative resolution by Leonhard Euler in 1736 laid the foundations of graph theory and prefigured the idea of topology.
 W
WA spatial network is a graph in which the vertices or edges are spatial elements associated with geometric objects, i.e. the nodes are located in a space equipped with a certain metric. The simplest mathematical realization is a lattice or a random geometric graph, where nodes are distributed uniformly at random over a two-dimensional plane; a pair of nodes are connected if the Euclidean distance is smaller than a given neighborhood radius. Transportation and mobility networks, Internet, mobile phone networks, power grids, social and contact networks and biological neural networks are all examples where the underlying space is relevant and where the graph's topology alone does not contain all the information. Characterizing and understanding the structure, resilience and the evolution of spatial networks is crucial for many different fields ranging from urbanism to epidemiology.
WIn mathematics, and more specifically in graph theory, a vertex or node is the fundamental unit of which graphs are formed: an undirected graph consists of a set of vertices and a set of edges, while a directed graph consists of a set of vertices and a set of arcs. In a diagram of a graph, a vertex is usually represented by a circle with a label, and an edge is represented by a line or arrow extending from one vertex to another.