 W
WThis is a list of software to create any kind of information graphics:either includes the ability to create one or more infographics from a provided data set either it is provided specifically for information visualization
 W
WDataScene is a scientific graphing, animation, data analysis, and real-time data monitoring software package. It was developed with the Common Language Infrastructure technology and the GDI+ graphics library. With the two Common Language Runtime engines - the .Net and Mono frameworks - DataScene runs on all major operating systems.
DISLIN is a high-level plotting library developed by Helmut Michels at the Max Planck Institute for Solar System Research in Göttingen, Germany. Helmut Michels currently works as a mathematician and Unix system manager at the computer center of the institute.
 W
WOld name ""EJS"" Easy Java Simulations or new name since 2014 EJSS, or Easy JavaScript Simulations, is an open-source software tool, part of the Open Source Physics project, designed for the creation of discrete computer simulations.
 W
WEuler is a free and open-source numerical software package. It contains a matrix language, a graphical notebook style interface, and a plot window. Euler is designed for higher level math such as calculus, optimization, and statistics.
FlexPro is a software package for analysis and presentation of scientific and technical data, produced by Weisang GmbH. It runs on Microsoft Windows and is available in English, German, Japanese, Chinese and French. FlexPro has its roots in the test and measurement domain and supports different binary file formats of data acquisition instruments and software. In particular, FlexPro can analyze large amounts of data with high sampling rates.
 W
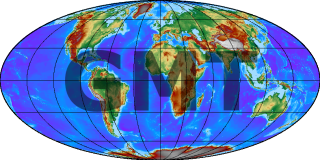
WGeneric Mapping Tools (GMT) are an open-source collection of computer software tools for processing and displaying xy and xyz datasets, including rasterisation, filtering and other image processing operations, and various kinds of map projections. The software stores 2-D grids as COARDS-compliant netCDF files and comes with a comprehensive collection of free GIS data, such as coast lines, rivers, political borders and coordinates of other geographic objects. Users convert further data from other sources and import them. GMT stores the resulting maps and diagrams in PostScript (PS) or Encapsulated PostScript (EPS) format.
 W
WGnumeric is a spreadsheet program that is part of the GNOME Free Software Desktop Project. Gnumeric version 1.0 was released on 31 December 2001. Gnumeric is distributed as free software under the GNU GPL license; it is intended to replace proprietary spreadsheet programs like Microsoft Excel. Gnumeric was created and developed by Miguel de Icaza, but he has since moved on to other projects. The maintainer as of 2002 was Jody Goldberg.
 W
Wgnuplot is a command-line program that can generate two- and three-dimensional plots of functions, data, and data fits. The program runs on all major computers and operating systems . It is a program with a fairly long history, dating back to 1986. Despite its name, this software is not part of the GNU Project.
 W
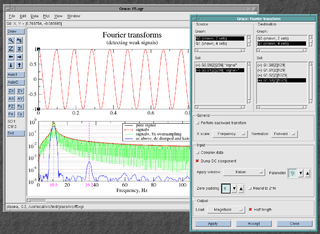
WGrace is a free WYSIWYG 2D graph plotting tool, for Unix-like operating systems. The package name stands for "GRaphing, Advanced Computation and Exploration of data." Grace uses the X Window System and Motif for its GUI. It has been ported to VMS, OS/2, and Windows 9*/NT/2000/XP. In 1996, Linux Journal described Xmgr as one of the two most prominent graphing packages for Linux.
 W
WGraphCalc is an open-source computer program that runs in Microsoft Windows and Linux that provides the functionality of a graphing calculator.
 W
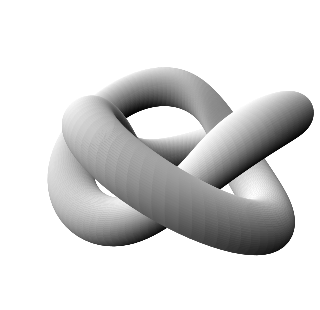
WGrapher is a computer program bundled with macOS since version 10.4 that is able to create 2D and 3D graphs from simple and complex equations. It includes a variety of samples ranging from differential equations to 3D-rendered Toroids and Lorenz attractors. It is also capable of dealing with functions and compositions of them. One can edit the appearance of graphs by changing line colors, adding patterns to rendered surfaces, adding comments, and changing the fonts and styles used to display them. Grapher is able to create animations of graphs by changing constants or rotating them in space.
gretl is an open-source statistical package, mainly for econometrics. The name is an acronym for Gnu Regression, Econometrics and Time-series Library.
Gri is a programming language for creating scientific graphics. It is licensed under the terms of the GNU General Public License.
 W
WIGOR Pro is a scientific data analysis software, numerical computing environment and programming language that runs on Windows or Mac operating systems. It is developed by WaveMetrics Inc., and was originally aimed at time series analysis, but has since then evolved and covers other applications such as curve fitting and image processing. It comes with a fully functional programming language and compiler, but many functions are also accessible through menus. IGOR Pro is primarily known for its graphics capabilities, and like Origin and other similar programs, is often used to generate plots for scientific and other publications. Other features include the possibility of extending the built-in functions with external operations (XOP) allowing data acquisition, manipulation and analysis features, communication with external devices and in principle any other task that can be programmed in C or C++.
 W
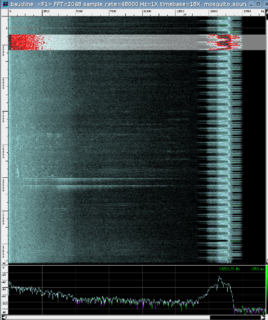
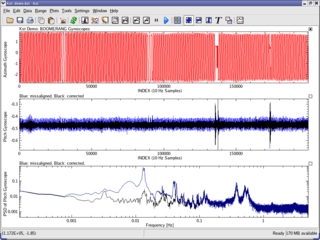
WKst is a plotting and data viewing program. It is a general purpose plotting software program that evolved out of a need to visualize and analyze astronomical data, but has also found subsequent use in the real time display of graphical information. Kst is a KDE application and is freely available for anyone to download and use under the terms of the GPL. It is noted for being able to graph real-time data acquisition.
 W
WLabPlot is a free software and cross-platform computer program for interactive scientific graphing and data analysis, written for the KDE desktop. It is similar to Origin and is able to import Origin's data files.
 W
WMaple is a symbolic and numeric computing environment as well as a multi-paradigm programming language. It covers several areas of technical computing, such as symbolic mathematics, numerical analysis, data processing, visualization, and others. A toolbox, MapleSim, adds functionality for multidomain physical modeling and code generation.
 W
WMapleSim is a Modelica-based, multi-domain modeling and simulation tool developed by Maplesoft. MapleSim generates model equations, runs simulations, and performs analyses using the symbolic and numeric mathematical engine of Maple. Models are created by dragging-and-dropping components from a library into a central workspace, resulting in a model that represents the physical system in a graphical form. Maplesoft began development of MapleSim partly in response to a request from Toyota to produce physical modeling tools to aid in their new model-based development process.
 W
WMathcad is computer software for the verification, validation, documentation and re-use of mathematical calculations in engineering and science, notably mechanical, chemical, electrical, and civil engineering. Released in 1986 on DOS, it introduced live editing (WYSIWYG) of typeset mathematical notation in an interactive notebook, combined with automatic computations. It is a product of Parametric Technology Corporation.
 W
WMayaVi is a scientific data visualizer written in Python, which uses VTK and provides a GUI via Tkinter. MayaVi was developed by Prabhu Ramachandran, is free and distributed under the BSD License. It is cross-platform and runs on any platform where both Python and VTK are available. MayaVi is pronounced as a single name, "Ma-ya-vee", meaning "magical" in Sanskrit. The code of MayaVi has nothing in common with that of Autodesk Maya or the Vi text editor.
 W
WNuCalc, also known as Graphing Calculator, is a computer software tool made by the company Pacific Tech. The tool can perform many graphing calculator functions. It can graph inequalities and vector fields, as well as functions in two, three, or four dimensions. It supports several different coordinate systems, and can solve equations. It is available for OS X and Microsoft Windows.
Origin is a proprietary computer program for interactive scientific graphing and data analysis. It is produced by OriginLab Corporation, and runs on Microsoft Windows. It has inspired several platform-independent open-source clones and alternatives like LabPlot and SciDAVis.
 W
WPloticus is a free, open-source (GPL) computer program for producing plots and charts from data. It runs under Unix, Solaris, Mac OS X, Linux and Win32 systems. Community support is customarily done through Yahoo News Groups.
Plotly is a technical computing company headquartered in Montreal, Quebec, that develops online data analytics and visualization tools. Plotly provides online graphing, analytics, and statistics tools for individuals and collaboration, as well as scientific graphing libraries for Python, R, MATLAB, Perl, Julia, Arduino, and REST.
 W
WQtiPlot is a cross-platform computer program for interactive scientific graphing and data analysis. It is similar to the proprietary programs Origin or SigmaPlot.
ROOT is an object-oriented program and library developed by CERN. It was originally designed for particle physics data analysis and contains several features specific to this field, but it is also used in other applications such as astronomy and data mining. The latest release is 6.22.00, as of 2020-07-02.
 W
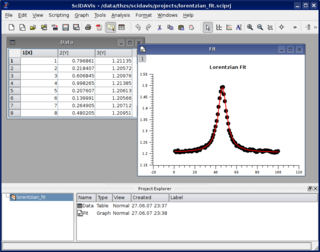
WSciDAVis is an open-source cross-platform computer program for interactive scientific graphing and data analysis. Development started in 2007 as fork of QtiPlot, which in turn is a clone of the proprietary program Origin.
SigmaPlot is a proprietary software package for scientific graphing and data analysis. It runs on Microsoft Windows.
 W
WTecplot is the name of a family of visualization & analysis software tools developed by American company Tecplot, Inc., which is headquartered in Bellevue, Washington. The firm was formerly operated as Amtec Engineering. In 2016, the firm was acquired by Vela Software, an operating group of Constellation Software, Inc. (TSX:CSU).
 W
WTrendalyzer is an information visualization software for animation of statistics that was initially developed by Hans Rosling's Gapminder Foundation in Sweden. In March 2007 it was acquired by Google Inc. The current beta version is a Flash application that is preloaded with statistical and historical data about the development of the countries of the world.
 W
WVeusz is a scientific plotting package. Veusz is a Qt application written in Python, PyQt and NumPy. It is freely available for anyone to distribute under the terms of the GPL. It is designed to produce publication-quality plots. The name should be pronounced as "views".
 W
WVisIt is an open-source interactive parallel visualization and graphical analysis tool for viewing scientific data. It can be used to visualize scalar and vector fields defined on 2D and 3D structured and unstructured meshes. VisIt was designed to handle very large data set sizes in the terascale range and yet can also handle small data sets in the kilobyte range.
 W
WWinplot is a general-purpose plotting utility for Microsoft Windows that can draw curves and surfaces presented in a variety of formats.
Wolfram Mathematica is a modern technical computing system spanning most areas of technical computing — including neural networks, machine learning, image processing, geometry, data science, visualizations, and others. The system is used in many technical, scientific, engineering, mathematical, and computing fields. It was conceived by Stephen Wolfram and is developed by Wolfram Research of Champaign, Illinois. The Wolfram Language is the programming language used in Mathematica.