 W
WIn statistics, Bayesian linear regression is an approach to linear regression in which the statistical analysis is undertaken within the context of Bayesian inference. When the regression model has errors that have a normal distribution, and if a particular form of prior distribution is assumed, explicit results are available for the posterior probability distributions of the model's parameters.
WIn statistics, Bayesian multivariate linear regression is a Bayesian approach to multivariate linear regression, i.e. linear regression where the predicted outcome is a vector of correlated random variables rather than a single scalar random variable. A more general treatment of this approach can be found in the article MMSE estimator.
WThe method of least squares is a standard approach in regression analysis to approximate the solution of overdetermined systems by minimizing the sum of the squares of the residuals made in the results of every single equation.
WIn statistics, least-angle regression (LARS) is an algorithm for fitting linear regression models to high-dimensional data, developed by Bradley Efron, Trevor Hastie, Iain Johnstone and Robert Tibshirani.
WIn statistics, linear regression is a linear approach to modelling the relationship between a scalar response and one or more explanatory variables. The case of one explanatory variable is called simple linear regression; for more than one, the process is called multiple linear regression. This term is distinct from multivariate linear regression, where multiple correlated dependent variables are predicted, rather than a single scalar variable.
 W
WIn probability theory and statistics, the probit function is the quantile function associated with the standard normal distribution, which is commonly denoted as N(0,1). Mathematically, it is the inverse of the cumulative distribution function of the standard normal distribution, which is denoted as , so the probit is denoted as . It has applications in exploratory statistical graphics and specialized regression modeling of binary response variables.
 W
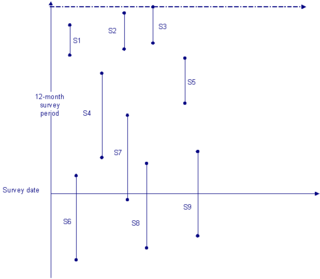
WStock sampling is sampling people in a certain state at the time of the survey. This is in contrast to flow sampling, where the relationship of interest deals with duration or survival analysis. In stock sampling, rather than focusing on transitions within a certain time interval, we only have observations at a certain point in time. This can lead to both left and right censoring. Imposing the same model on data that have been generated under the two different sampling regimes can lead to research reaching fundamentally different conclusions if the joint distribution across the flow and stock samples differ sufficiently.