 W
WIn statistics, an outlier is a data point that differs significantly from other observations. An outlier may be due to variability in the measurement or it may indicate experimental error; the latter are sometimes excluded from the data set. An outlier can cause serious problems in statistical analyses.
 W
WA bagplot, or starburst plot, is a method in robust statistics for visualizing two- or three-dimensional statistical data, analogous to the one-dimensional box plot. Introduced in 1999 by Rousseuw et al., the bagplot allows one to visualize the location, spread, skewness, and outliers of a data set.
WIn descriptive statistics, a box plot or boxplot is a method for graphically depicting groups of numerical data through their quartiles. Box plots may also have lines extending from the boxes (whiskers) indicating variability outside the upper and lower quartiles, hence the terms box-and-whisker plot and box-and-whisker diagram. Outliers may be plotted as individual points. Box plots are non-parametric: they display variation in samples of a statistical population without making any assumptions of the underlying statistical distribution. The spacings between the different parts of the box indicate the degree of dispersion (spread) and skewness in the data, and show outliers. In addition to the points themselves, they allow one to visually estimate various L-estimators, notably the interquartile range, midhinge, range, mid-range, and trimean. Box plots can be drawn either horizontally or vertically. Box plots received their name from the box in the middle.
 W
WDragon king (DK) is a double metaphor for an event that is both extremely large in size or impact and born of unique origins relative to its peers. DK events are generated by or correspond to mechanisms such as positive feedback, tipping points, bifurcations, and phase transitions, that tend to occur in nonlinear and complex systems, and serve to amplify DK events to extreme levels. By understanding and monitoring these dynamics, some predictability of such events may be obtained.
 W
WIsolation forest is an unsupervised learning algorithm for anomaly detection that works on the principle of isolating anomalies, instead of the most common techniques of profiling normal points.
 W
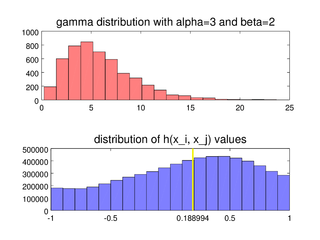
WIn statistics, the medcouple is a robust statistic that measures the skewness of a univariate distribution. It is defined as a scaled median difference of the left and right half of a distribution. Its robustness makes it suitable for identifying outliers in adjusted boxplots. Ordinary box plots do not fare well with skew distributions, since they label the longer unsymmetrical tails as outliers. Using the medcouple, the whiskers of a boxplot can be adjusted for skew distributions and thus have a more accurate identification of outliers for non-symmetrical distributions.
 W
WIn statistics, a studentized residual is the quotient resulting from the division of a residual by an estimate of its standard deviation. It is a form of a Student's t-statistic, with the estimate of error varying between points.