 W
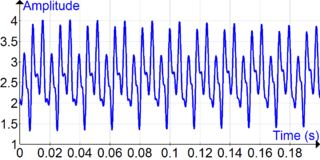
WA time series is a series of data points indexed in time order. Most commonly, a time series is a sequence taken at successive equally spaced points in time. Thus it is a sequence of discrete-time data. Examples of time series are heights of ocean tides, counts of sunspots, and the daily closing value of the Dow Jones Industrial Average.
 W
WA correlation function is a function that gives the statistical correlation between random variables, contingent on the spatial or temporal distance between those variables. If one considers the correlation function between random variables representing the same quantity measured at two different points, then this is often referred to as an autocorrelation function, which is made up of autocorrelations. Correlation functions of different random variables are sometimes called cross-correlation functions to emphasize that different variables are being considered and because they are made up of cross-correlations.
 W
WIn mathematics, Fourier analysis is the study of the way general functions may be represented or approximated by sums of simpler trigonometric functions. Fourier analysis grew from the study of Fourier series, and is named after Joseph Fourier, who showed that representing a function as a sum of trigonometric functions greatly simplifies the study of heat transfer.
 W
WIn statistics, a moving average is a calculation to analyze data points by creating a series of averages of different subsets of the full data set. It is also called a moving mean (MM) or rolling mean and is a type of finite impulse response filter. Variations include: simple, and cumulative, or weighted forms.
 W
WIn the statistics of time series, and in particular the stock market technical analysis, a moving-average crossover occurs when, on plotting two moving averages each based on different degrees of smoothing, the traces of these moving averages cross. It does not predict future direction but shows trends. This indicator uses two moving averages, a slower moving average and a faster moving average. The faster moving average is a short term moving average. For end-of-day stock markets, for example, it may be 5-, 10- or 25-day period while the slower moving average is medium or long term moving average. A short term moving average is faster because it only considers prices over short period of time and is thus more reactive to daily price changes. On the other hand, a long term moving average is deemed slower as it encapsulates prices over a longer period and is more lethargic. However, it tends to smooth out price noises which are often reflected in short term moving averages.
 W
WPhase dispersion minimization (PDM) is a data analysis technique that searches for periodic components of a time series data set. It is useful for data sets with gaps, non-sinusoidal variations, poor time coverage or other problems that would make Fourier techniques unusable. It was first developed by Stellingwerf in 1978 and has been widely used for astronomical and other types of periodic data analyses. Source code is available for PDM analysis. The current version of this application is available for download.
 W
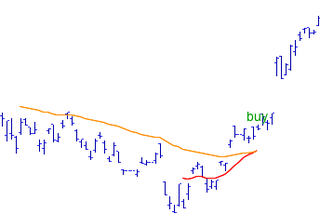
WThe rising moving average is a technical indicator used in stock market trading. Most commonly found visually, the pattern is spotted with a moving average overlay on a stock chart or price series. When the moving average has been rising consecutively for a number of days, this is used as a buy signal, to indicate a rising trend forming.
 W
WIn econometrics and statistics, a structural break is an unexpected change over time in the parameters of regression models, which can lead to huge forecasting errors and unreliability of the model in general. This issue was popularised by David Hendry, who argued that lack of stability of coefficients frequently caused forecast failure, and therefore we must routinely test for structural stability. Structural stability − i.e., the time-invariance of regression coefficients − is a central issue in all applications of linear regression models.