 W
WThis is a list of countries by apricot production in 2016 and 2017, based on data from the Food and Agriculture Organization Corporate Statistical Database. The estimated total world production for apricots in 2017 was 4,257,241 metric tonnes, up 9.7% from 3,766,079 tonnes in 2016.
 W
WThis is a list of countries by artichoke production in 2016, based on data from the Food and Agriculture Organization Corporate Statistical Database. The estimated total world artichoke production for 2016 was 1,422,248 metric tonnes.
 W
WThis is a list of countries by barley production in 2016 based on the Food and Agriculture Organization Corporate Statistical Database. The total world barley production for 2016 was 141,277,993 metric tonnes.
 W
WThis is a list of countries by cherry production from the years 2016 to 2018, based on data from the Food and Agriculture Organization Corporate Statistical Database. The estimated total world production for 2018 was 4,076,944 metric tonnes, increasing by 12.9% from 3,611,283 tonnes in 2017.
 W
WThis is a list of countries by coconut production in 2016 and 2017, based on data from the Food and Agriculture Organization Corporate Statistical Database. The estimated total world production for coconuts in 2018 was 61,865,423 metric tonnes, up 2.4% from 60,444,228 tonnes in 2017. Dependent territories are shown in italics.
 W
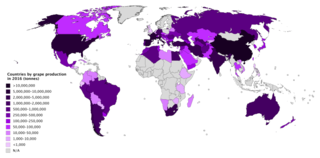
WThis is a list of countries by grape production in 2016 and 2017, based on data from the Food and Agriculture Organization Corporate Statistical Database. The estimated total world production for grapes in 2017 was 74,276,583 metric tonnes, down 1.0% from 74,992,047 tonnes in 2016. China was the largest producer of grapes, accounting for 16.8% of global production. Italy came second at 10.9%, followed by the United States at 9.6%.
 W
WThis is a list of countries by cucumber production in 2016 and 2017, based on data from the Food and Agriculture Organization Corporate Statistical Database. The estimated total world production for cucumbers in 2017 was 83,753,861 metric tonnes, up 3.9% from 80,616,692 tonnes in 2016. China was by far the largest producer, accounting for over 77% of global production at 64,824,643 tonnes. Dependent territories are shown in italics.
 W
WThis is a list of countries by eggplant (aubergine) production in 2016 and 2017, based on data from the Food and Agriculture Organization Corporate Statistical Database. The estimated total world production for eggplants in 2017 was 52,309,119 metric tonnes, up by 2.2% from 51,192,811 tonnes in 2016. China was by far the largest producer of eggplants, accounting for over 62% of global production. Dependent territories are shown in italics.
 W
WThis is a list of countries by garlic production in 2016, based on data from the Food and Agriculture Organization Corporate Statistical Database. The total world production for garlic in 2016 was 26,573,001 metric tonnes. China was by far the largest producer, accounting for nearly 80% of world production at 21,197,131 tonnes.
 W
WThis is a list of countries by industrial production growth rate mostly based on The World Factbook, accessed in December 2018.
 W
WThis is a list of countries by apple production in 2016 and 2017, based on data from the Food and Agriculture Organization Corporate Statistical Database. The estimated total world production of
 W
WThis is a list of countries by motor vehicle production based on Organisation Internationale des Constructeurs d'Automobiles (OICA) and other data from 2016 and earlier.Figures include passenger cars, light commercial vehicles, minibuses, trucks, buses and coaches.
 W
WThis is a list of countries by papaya production in 2016 and 2017, based on data from the Food and Agriculture Organization Corporate Statistical Database. The estimated total world production for papayas in 2017 was 13,016,281 metric tonnes, down 0.6% from 13,097,219 tonnes in 2016. India was by far the largest producer, accounting for nearly 46% of global production. Dependent territories are shown in italics.
 W
WThis is a list of countries by pear production in 2016 and 2017, based on data from the Food and Agriculture Organization Corporate Statistical Database. The estimated total world production for pears in 2017 was 24,168,309 metric tonnes, an increase of 2.1% from 23,676,110 tonnes in 2016. China was by far the largest producer, accounting for over 67% (two-thirds) of global production.
 W
WThis is a list of countries by pineapple production in 2016 and 2017, based on data from the Food and Agriculture Organization Corporate Statistical Database. The estimated total world production for pineapples in 2017 was 27,402,956 metric tonnes, an increase of 4.6% from 26,195,845 tonnes in 2016. Dependent territories are shown in italics.
 W
WThis is a list of countries by plum and sloe production in 2016 and 2017, based on data from the Food and Agriculture Organization Corporate Statistical Database. The estimated total world production of plum and sloe for 2017 was 11,758,135 metric tonnes, down 1% from 11,875,874 tonnes in 2016. China was by far the largest producer, accounting for nearly 58% of global production.
 W
WThis is a list of countries by potato production in 2016, based on data from the Food and Agriculture Organization Corporate Statistical Database. The total world production for potatoes in 2016 was 376,826,967 metric tonnes. China was by far the largest producer, accounting for 26.3% of world production. Dependent territories are shown in italics. Total production in 2019 was 423 mln tonnes.
 W
WThis is a list of countries by soybean production in 2018, based on data from the Food and Agriculture Organization Corporate Statistical Database. The total world production for soybeans in 2018 was 348,712,311 metric tonnes. Brazil was the largest producer, accounting for 36% of world production. Many nation have launched government soybean support programs in their countries.
 W
WThis is a list of countries by tomato production in 2016 and 2017, based on data from the Food and Agriculture Organization Corporate Statistical Database. The estimated total world production for tomatoes in 2017 was 182,301,395 metric tonnes, an increase of 1.6% from 179,508,401 tonnes in 2016. China was by far the largest producer, accounting for nearly 33% of global production. Dependent territories are shown in italics.
 W
WThe following international wheat production statistics come from the Food and Agriculture Organization figures from FAOSTAT database, older from International Grains Council figures from the report "Grain Market Report".
 W
WThis list of wine-producing regions catalogues significant growing regions where vineyards are planted. Wine grapes mostly grow between the 30th and the 50th degree of latitude, in both the Northern and Southern hemispheres. Grapes will sometimes grow beyond this range, thus minor amounts of wine are made in some rather unexpected places.